PULSE-OXYMETRY HISTORY
HEMOGLOBIN AND SATURATION


Oximetry is the measurement of transmitted light through a translucent measuring site to determine a patient's oxygen status noninvasively. Oximetry measurements can be traced to the early 1930's when German investigators used spectrophotometers (instruments that measure different wavelengths and intensities of light) to research light transmission through human skin. In 1935, Karl Matthes reported measuring oxygen saturation in blood flowing through closed vessels in animals. In 1939, German researchers reported use of an "ear oxygen meter" that used red and infrared light to compensate for changes in tissue thickness, blood content, light intensities and other variables. However, it was not until World War II that interest in oximetry took hold. At that time there was a need to evaluate oxygenation of high altitude pilots. Between 1940 and 1942, a British researcher, Millikan, used two wavelengths of light to produce a practical, lightweight aviation ear oxygen meter for which he coined the word "oximeter" for the Air Force. He noted that light transmitted through a red filter was oxygen-saturation-sensitive and light passing through a green filter was independent of oxygen saturation. It was later determined that oxygen insensitive-signals were not due to the green light filter but instead to infrared light. In 1949 Woods adds a pressure capsule in order to squeeze blood out of the ear to obtain zero setting in an effort to obtain absolute O2 saturation value when blood was readmitted. Due to unstable nature of photocells and light sources it was never applied clinically.
In 1964, a San Francisco surgeon (Robert Shaw) developed a self-calibrating, 8- wavelength oximeter that was marketed by Hewlett Packard in the 1970's. This system was used in clinical environments but was very large, weighing approximately 35 lbs., and had a bulky, clumsy earpiece. The unit was also very expensive (approximately $10,000.00). However, it did allow for continuous noninvasive monitoring of arterial oxygenation. In the early 1970's, Takuo Aoyagi, a Japanese bioengineer, found that light transmitted through the ear exhibited pulsatile variations that made it impossible to compute cardiac output. Fortunately, he was also interested in oximetry and was familiar with previous oximetry work. He recognized that he might be able to use the pulsating changes in the light transmission through the ear to measure arterial oxygen saturation.
Hemoglobin is the iron-containing oxygen-transport metalloprotein in the red blood cells making up about 96% of the red blood cells' dry content (by weight), and around 35% of the total content (including water). Hemoglobin has an oxygen-binding capacity of 1.34 mL O2 per gram, which increases the total blood oxygen capacity seventy-fold compared to dissolved oxygen in blood.
The hemoglobin molecule is an assembly of four globular protein subunits. Each subunit is composed of a protein chain tightly associated with a non-protein prosthetic heme group. As such, one hemoglobin molecule has four associated heme groups. A heme group consists of an iron (Fe) ion held in a heterocyclic ring. This ring consists of four pyrrole molecules cyclically linked together (by methine bridges) with the iron ion bound in the center. The iron ion, which is the site of oxygen binding, coordinates with the four nitrogen atoms in the center of the ring, which all lie in one plane. The iron is covalently bound to the globular protein via the N atoms. A sixth position can reversibly bind oxygen by a coordinate covalent bond. Note that even though carbon dioxide is carried by hemoglobin, it does not compete with oxygen for the iron-binding positions but is bound to the protein chains of the structure.

Figure 1 - Heme group.
The iron ion may be either in the Fe2+ or in the Fe3+ state, the latter one being only an intermediate step in the process of oxygen binding. However, Fe2+ must exist before so oxygen can bind to it.
Going back to the hemoglobin molecule, when an oxygen interacts with one of the heme groups in one of the four chains it causes a conformational change in the next subunit. This conformational shift will increase that group’s affinity for oxygen. This is called allosteric interaction and is the effect that gives shape to the oxygen dissociation curve.

Figure 2 - Hemoglobin dissoaciation curve.
Note that if the dissociation curve shifts to the right hemoglobin will be more susceptible of releasing oxygen (as with the same PO2 we have a lower saturation). Factors that influence this rightward shift are low pH, high temperature, high PCO2 and a high BPG concentration. On the other hand, a shift to the left will translate into hemoglobin being more affine for oxygen (again, lower PO2 will result in higher saturation). Factors that favor this leftward shift are high pH, low temperature, low PCO2 and a decrease in overall BPG concentration.
BEER’S LAW
The attenuation of light traveling through an uniform medium containing an absorbing substance (such as blood) can be described through Beer’s law. This law states that if monochromatic incident light of an intensity 𝐼𝑜 enters the medium, a part of this light is transmitted through it while another part is absorbed. The intensity 𝐼 of light travelling through the medium decreases exponentially according to
𝑰 = 𝑰𝒐·𝒆^(−𝜺(𝛌)𝒄𝒅)
Where 𝜀(λ) represents the extinction coefficient or absorptivity of the absorbing substance at the specified wavelength lambda, 𝑐 is the concentration of the absorbing substance in that medium (which is defined to be constant along it), and 𝑑 is the optical path length through the medium.

Figure 3 - Representation of Beer's law.
Beer’s law is based on the property that the sum of transmitted and absorbed light equals the incident light. It does not account for physical processes which include reflection of light at the surface of the medium or scattering of light in the same. We can define a couple of parameters using Beer’s law;
The transmittance of light travelling through a medium with an absorbing substance is defined as the ratio of transmitted light to the incident light, and as such:
𝑻 = 𝑰/𝑰𝒐 = 𝒆^(−𝜺(𝛌)𝒄𝒅)
The unscattered absorbance (also referred to as optical density of the medium) is defined as the negative natural logarithm of light’s transmittance:
𝑨 = −𝐥𝐧(𝑻) = 𝜺(𝛌)𝒄𝒅
Indeed we can extend Beer’s law to multiple absorbers as the superposition of the individual absorbing processes. As a result, the total resulting absorbance can be expressed as:
𝑨𝒕 = 𝜺𝟏(𝛌)·𝒄𝟏·𝒅𝟏 + 𝜺𝟐(𝛌)·𝒄𝟐·𝒅𝟐 + ⋯ + 𝜺𝒏(𝛌)·𝒄𝒏·𝒅𝒏 = Σ𝜺𝒊(𝛌)·𝒄𝒊·𝒅𝒊
Therefore, Beer’s law allows us to determine the unknown concentrations of n different absorbing substances in a homogeneous medium if the absorbance of light is measured at n different wavelengths, and provided that the extinction coefficients for that substances at those wavelengths are known.
BEER’S LAW APPLIED TO PULSE OXYMETRY
As such hemoglobin is the main light absorber in human blood (there are other substances) in human blood at the typical wavelengths. Moreover, its absorbing properties change with its chemical binding. Although oxygenated and reduced hemoglobin absorb most of the light passing through blood, they do not represent the only two hemoglobin species present in human blood. Hemoglobin may combine with other substances such as carbon monoxide or hydrogen sulfide as well, which changes its color. As most of the hemoglobin present in an individual are functional, we will only focus on those.
When hemoglobin is fully saturated with oxygen (carrying four oxygen molecules), it is called oxyhemoglobin (HbO2). If it is not fully saturated with oxygen it is called reduced hemoglobin (Hb). The functional oxygen saturation (functional SO2) is measured in percentage and determined by the amount of oxygenated hemoglobin (HbO2) as compared to the sum of oxygenated and reduced hemoglobin (Hb).
𝑭𝒖𝒏𝒄𝒕𝒊𝒐𝒏𝒂𝒍 𝑺𝑶𝟐 = 𝑯𝒃𝑶𝟐/(𝑯𝒃+𝑯𝒃𝑶𝟐) × 𝟏𝟎𝟎% = 𝒄𝑯𝒃𝑶𝟐 /(𝒄𝑯𝒃𝑶𝟐+𝒄𝑯𝒃) × 𝟏𝟎𝟎%
According to Beer’s law we can derive the total absorbance of a solution containing only reduced and oxygenated hemoglobin as absorbing substances. This is expressed as:
𝑨𝒕 = 𝜺𝑯𝒃𝑶𝟐(𝛌)·𝒄𝑯𝒃𝑶𝟐·𝒅𝑯𝒃𝑶𝟐 + 𝜺𝑯𝒃(𝛌)·𝒄𝑯𝒃·𝒅𝑯𝒃
Assuming that the reduced and oxygenated hemoglobin’s optical path lengths are equal we can reduce the previous equation to:
𝑨𝒕 = [𝜺𝑯𝒃𝑶𝟐(𝛌)·𝒄𝑯𝒃𝑶𝟐 + 𝜺𝑯𝒃(𝛌)·𝒄𝑯𝒃]·𝒅
However, we have two unknowns, which are the concentrations of both hemoglobin types. However, if we use two wavelengths instead of one we arrive at a linear system of two equations with two unknowns which can be easily solved.
𝑨𝒕𝟏 = [𝜺𝑯𝒃𝑶𝟐(𝛌𝟏)·𝒄𝑯𝒃𝑶𝟐 + 𝜺𝑯𝒃(𝛌𝟏)·𝒄𝑯𝒃]·𝒅
𝑨𝒕𝟐 = [𝜺𝑯𝒃𝑶𝟐(𝛌𝟐)·𝒄𝑯𝒃𝑶𝟐 + 𝜺𝑯𝒃(𝛌𝟐)·𝒄𝑯𝒃]·𝒅
The optical path length can be, in this way, factored out of the equation and we only need to know the extinction coefficients at wavelengths 1 and 2 for both the oxyhemoglobin and the reduced hemoglobin. Of course, provided that we measure the absorbance at both wavelengths.
EXCTINCTION COEFFICIENTS
The graph below shows the extinction coefficients of oxyhemoglobin and reduced hemoglobin at wavelengths in the range of interest in pulse oximetry. The absorbance of light in the red region of the spectrum is much higher for reduced hemoglobin than for oxyhemoglobin. The extinction coefficients of both hemoglobin species are equal at the point isosbestic point (805 nm). The reduced hemoglobin is more transparent to light from the infrared region than oxyhemoglobin.
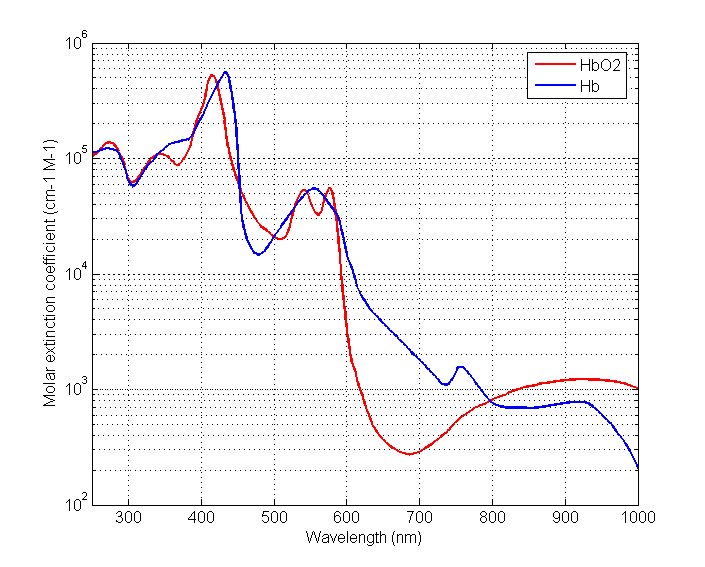
Figure 4 - Exctinction coefficients for HbO2 and Hb.
Different reasons lead to the most common choice for wavelengths used in pulse oximetry. The red skin pigmentation absorbs a great amount of light at wavelengths shorter than 600 nm and therefore it is not desirable to measure light absorbance in this range. Large differences in the extinction coefficients of reduced hemoglobin and oxygenated hemoglobin change the absorbance of light significantly, even when the oxygen saturation changes slightly. A good choice for a wavelength in the red region is 660 nm because of a large difference in the extinction coefficients. Another reason to choose this particular wavelengths is “spectral flatness”. Take, for example, the region between 590 and 640 nm, there is a huge slope which would result in high variations in the measurements. Some other good “flat” points are at 735, 890, and 940 nm.
PULSATION OF BLOOD
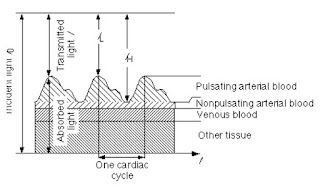
The arteries contain more blood during systole than during diastole, and therefore, their diameter increases due to increased pressure. This effect occurs only in the arteries and arterioles but not in the veins. The absorbance of light in tissues with arteries increases during systole mainly because of the larger amount of absorbing substances (hemoglobin), due to the fact that the optical path length d in the arteries increases. This alternating part of the total absorbance allows us to differentiate between the absorbance due to venous blood, a constant amount of arterial blood, and other non-pulsatile components such as skin pigmentation (DC component of the total absorbance) and the absorbance due to the pulsatile component of the arterial blood (AC component).
Let’s refer to the measured intensity during the diastole as 𝐼𝐻 (or high intensity), as it will be higher than that during systole. The present absorbers are those of tissues and venous blood which will contribute to a DC component. As there is already some non-pulsating arterial blood, we will include it as a DC component as well, but separated. Note that for diastole the optical path length is smaller (and in fact the minimum). And thus:
𝑰𝑯 = 𝑰𝒐·𝒆^(−𝜺𝑫𝑪(𝛌)·𝒄𝑫𝑪·𝒅𝑫𝑪)·𝒆^(−[𝜺𝑯𝒃𝑶𝟐(𝛌)·𝒄𝑯𝒃𝑶𝟐+𝜺𝑯𝒃(𝛌)·𝒄𝑯𝒃]·𝒅𝒎𝒊𝒏)
During systole the optical path length will increase, and a new intensity value will be read, namely 𝐼𝐿 (or low intensity). The optical path length will be maximum and, as such we will describe the intensity as follows:
𝑰𝑳 = 𝑰𝒐·𝒆^(−𝜺𝑫𝑪(𝛌)·𝒄𝑫𝑪·𝒅𝑫𝑪)·𝒆^(−[𝜺𝑯𝒃𝑶𝟐(𝛌)·𝒄𝑯𝒃𝑶𝟐+𝜺𝑯𝒃(𝛌)·𝒄𝑯𝒃]·𝒅𝒎𝒂𝒙)
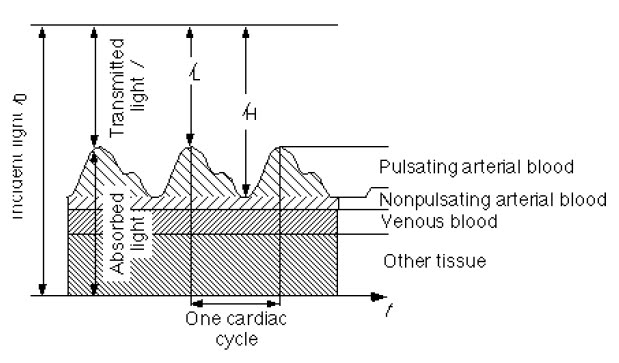
Figure 6 - Pulsation of blood and its effect on transmittance.
We can, rewrite the two equations above as a function of the optical path length, just by defining 𝐼𝐻 as the bottom-line intensity and letting the optical path length vary between 𝑑𝑚𝑖𝑛 and 𝑑𝑚𝑎𝑥 (defining Δ𝑑∈[0,(𝑑𝑚𝑎𝑥−𝑑𝑚𝑖𝑛)].
𝑰 = 𝑰𝑯·𝒆^(−[𝜺𝑯𝒃𝑶𝟐(𝛌)·𝒄𝑯𝒃𝑶𝟐+𝜺𝑯𝒃(𝛌)·𝒄𝑯𝒃]·Δ𝒅)
The measured light intensities at the different wavelengths have to be normalized before they can be compared with each other due to the fact that the light-emitting diodes (LEDs) may emit light with different intensities. The absorbing characteristics of the DC components and the sensitivity of the photo-detector differ for the two different wavelengths and the tissue absorption and path length varies widely from patient to patient and with the probe site. The normalized signal 𝐼𝑛 is calculated by dividing the transmitted light intensities (the raw signals) by their individual maximum peak (for both wavelengths separately):
𝑰𝒏 = 𝑰/𝑰𝑯 = 𝒆^(−[𝜺𝑯𝒃𝑶𝟐(𝛌)·𝒄𝑯𝒃𝑶𝟐+𝜺𝑯𝒃(𝛌)·𝒄𝑯𝒃]·Δ𝒅)
This will result in a 1 during the diastole, and on an exponential curve otherwise. Moreover, the AC components of the normalized signals represent only changes of transmitted light caused by the pulsation of blood in the arteries and can be compared with each other and between different wavelengths.
The next step is to calculate the absorbances by taking the natural of the normalized signals (the sign doesn’t matter, as we will calculate the ratio between the two different wavelengths). By doing so we bring the exponent down, as follows:
𝑨𝒕 = −𝐥𝐧(𝑰/𝑰𝑯) = −𝐥𝐧[ 𝒆^(−[𝜺𝑯𝒃𝑶𝟐(𝛌)·𝒄𝑯𝒃𝑶𝟐+𝜺𝑯𝒃(𝛌)·𝒄𝑯𝒃]·Δ𝒅) ] = [𝜺𝑯𝒃𝑶𝟐(𝛌)·𝒄𝑯𝒃𝑶𝟐+𝜺𝑯𝒃(𝛌)·𝒄𝑯𝒃]·Δ𝒅
In order to directly obtain and solve for the oxygen saturation we need to apply a change of variables. By rewriting the concentrations as a function of the saturation;
𝑺𝑶𝟐 = 𝒄𝑯𝒃𝑶𝟐/(𝒄𝑯𝒃𝑶𝟐+𝒄𝑯𝒃) → 𝒄𝑯𝒃𝑶𝟐 = 𝑺𝑶𝟐·(𝒄𝑯𝒃𝑶𝟐+𝒄𝑯𝒃)
𝒄𝑯𝒃 = (𝟏−𝑺𝑶𝟐)·(𝒄𝑯𝒃𝑶𝟐+𝒄𝑯𝒃)
If we substitute both the oxyhemoglobin and reduced hemoglobin concentrations into the absorbance, we obtain an equation that depends on the oxygen saturation.
𝐴𝑡 = [𝜺𝑯𝒃𝑶𝟐(𝛌)·𝑺𝑶𝟐+𝜺𝑯𝒃(𝛌)·(𝟏−𝑺𝑶𝟐)]·(𝒄𝑯𝒃𝑶𝟐+𝒄𝑯𝒃)·Δ𝒅
When applied the ratio for both absorbances at the two different wavelengths we obtain:
𝑅 = 𝐴𝑡1/𝐴𝑡2 = 𝜺𝑯𝒃𝑶𝟐(𝛌𝟏)·𝑺𝑶𝟐+𝜺𝑯𝒃(𝛌𝟏)·(𝟏−𝑺𝑶𝟐)/(𝜺𝑯𝒃𝑶𝟐(𝛌𝟐)·𝑺𝑶𝟐+𝜺𝑯𝒃(𝛌𝟐)·(𝟏−𝑺𝑶𝟐) )
And we prove that the system can be solved independently of the optical path length and the concentrations. In fact, solving for the oxygen saturation will render the definitive equation to obtain the value by means of the measured and normalized intensities.
𝑺𝒂𝑶𝟐 = [𝜺𝑯𝒃(𝛌𝟏)−𝜺𝑯𝒃(𝛌𝟐)·𝑹]/[𝜺𝑯𝒃(𝛌𝟏)−𝜺𝑯𝒃𝑶𝟐(𝛌𝟏)+⌈𝜺𝑯𝒃(𝛌𝟐)−𝜺𝑯𝒃𝑶𝟐(𝛌𝟐)⌉·𝑹] ×𝟏𝟎𝟎%
Where the only unknown is R, which can be measured. As a simplification we can assume that:
𝑺𝒂𝑶𝟐 = 𝑯𝒃𝑶𝟐𝑯𝒃 + 𝑯𝒃𝑶𝟐 ≈ 𝑰𝒏,𝟏/𝑰𝒏,𝟐
Alexander Martínez Pasek
Biomedical Instrumentation